Thanks to SIST and the financial support of my lab, I was able to attend a training course on Sensor Observation Services (SOS) with one of my coworkers. It’s time to reflect a bit on what we learned!
Why do Sensors matter for a geographer/social scientist?
My previous experience with sensors was limited to academic contexts; I remember using them in forests to collect information (temperature, luminosity, etc … ). My contribution under the “research” budget included protecting the equipment from ant colonies intent on building nests on top of the electronics. With their high cost and complicated setup and maintenance, I was under the impression that the “world of sensors” will stay in academia or closely related fields.
I was wrong. First, the cost of sensors has significantly dropped. Second, they are now more broadly used. Currently part of the “smart city”, they may one day be part of “smart forests” (Gabrys 2020) and are already used in the monitoring of other environments (rivers come to mind).
As sensors become more common, they produce data that will be used in new ways. To this spatial expansion of monitoring, we can also add a diversification in their user bases. Citizens and artists are also using them with a wide variety of goals.
SOS?
SOS is a standard for a Web service promoted by the Open Geospatial Consortium (OGC). This standard, used to query real-time sensor data or data time series is a little less well-known than their other Web Services (for example, Web Feature Services, WFS).
The SOS standard is an implementation of the O&M and SensorML models. The first one, O&M, gives insights about the observational model (what, when and how something gets measured) and the sampling model (how these observations relate to the feature of interest). The second, SensorML, mainly describes sensors. Both of these models use XML, like SOS, but luckily, SOS can also use JSON to transfer data (and a RESTful API).
It can be used to query some data but also allow new sensors to be registered and even new values to be inserted. Here, we will focus on querying. Keep in mind that we worked on stationary sensors, but mobile ones can also be implemented.
Technical Jargon
Even with a good wiki page and OGC documentation, SOS can be a bit cryptic at first and to be fair, defining an “observation” is by no means an easy task! To help us wrap our minds around it, I will explain the technology through the example of the city of Lyon’s noise monitoring network
Some insight about it can be found here and on the gouv web site. It is in French, but I’m sure that’s not a problem for anyone ;)
Observations
This network monitors noise in various places. Places are called Features of Interest (FOI), featureOfInterest in XML. One of them is here urn:ogc:def:feature:x-istsos:1.0:Point:Berthelot. This is more simple that it looks: we have an Uniform Resource Name from OGC that defines a feature in istSOS (the service we will use) version 1.0. This feature is a point and has the name (identifier) of Berthelot. Now we would like to collect observations about noise here. To do that, we will use a procedure : a way to collect observations. The procedure has a location (coordinates with a coordinate reference system) Here this is done with one sensor but it can be done with more than one or/and using some processes. Our FOI have the procedure/sensor AF01 associated (urn:ogc:def:procedure:x-istsos:1.0:AF01). It is monitoring at least one observed property (observedProperty). AF01 produce 4 of them (lday, levening, lnight). lday is a noise level, taking into account human ears in decibels, calculated during daylight hours (6am-6pm). Eventually we will get a result, let’s say 62.8 dB(A). dB(A) is our unit of measure (uom). Time is usually expressed in ISO 8601 (2021-02-06T06:00:00.000000Z).
Together, all of the above make an observation!
Finally, offering enables you to make some logical grouping of observations.
Making use of what we learn
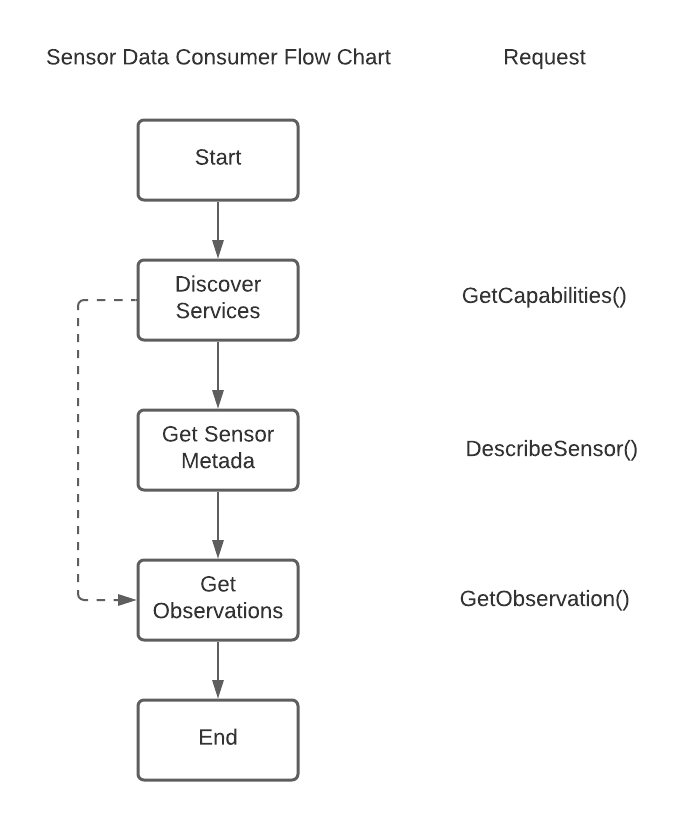
The schema below is adapted from the OGC documentation (p. 14 and 15). It shows the different steps required to collect data with an associate request. First, we need to know what kind of services are available.
The first part is the address: https://download.data.grandlyon.com/sos/bruit
(bruit means ‘noise’ in French)
Then, after ? we start the request specifying the service and the request. With this request we get an XML giving us all of the information about the service and what we can do with it. A quick scroll gives us the name of the procedures we can request information from and the output format provided.
We can now ask for more information about the sensor with DescribeSensor before getting observations.
This one looks a bit more complicated, so let’s examine it. We will still use the same address. Then, we will request DescribeSensor and we will ask for the only output format available: text/xml;subtype="sensorML/1.0.1". It looks a bit complicated, because some characters need to be escaped (outputFormat=text%2Fxml%3Bsubtype%3D%22sensorML%2F1.0.1%22). The last part is just asking for SOS version 1.0.
This request allows us to check the AllowedTimes for our next request : GetObservation.
Ok this result is HUGE! However, we have already built some understanding and I will explain the part that we haven’t seen yet. In SOS version 1.0, we need to specify the offering that groups our sensor (offering=observatoire_acoustique_grandlyon).
This information comes from the GetCapabilities. Then, we define our procedure and set up a time interval of interest (eventTime=2010-06-17T08:00:00+02:00/2021-01-23T07:00:00+01:00).
After that, we specify the observed property that we’re interested in (observedProperty=lday) and response format (responseFormat=text/plain). Just as before, these two pieces of insight come from the GetCapabilities. As you may have noticed, we don’t need to add all observed property and procedure definitions, just the identifier is fine (lday vs urn:ogc:def:parameter:::noise:lday).
Much more can and should be said (you can use bbox or aggregate in requests!) but let’s stop here. I hope that we can explore some ways to interact with http requests in R, soon!
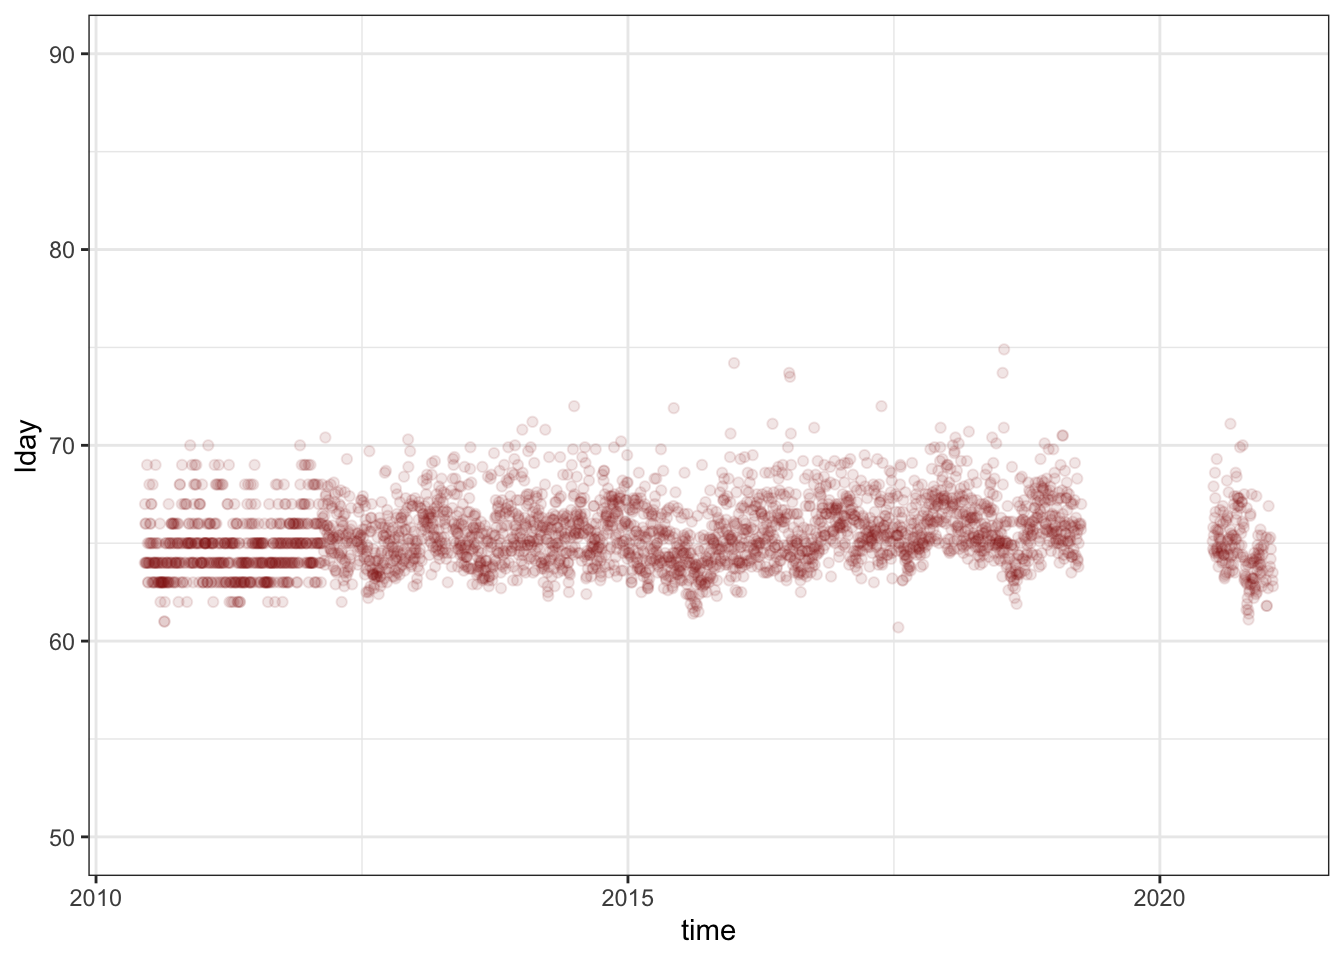
af01 <-read.csv("bruit.csv", header =FALSE)af01$V1 <- lubridate::as_datetime(af01$V1)names(af01) <-c("time", "sensor", "lday")quickplot <- ggplot2::ggplot(data = af01, ggplot2::aes( x = time, y = lday)) + ggplot2::geom_point(alpha = .1, col ="darkred") + ggplot2::ylim(c(50, 90)) + ggplot2::theme_bw()quickplot
References
Gabrys, Jennifer. 2020. “Smart Forests and Data Practices: From the Internet of Trees to Planetary Governance.”Big Data & Society 7 (1): 2053951720904871. https://doi.org/10.1177/2053951720904871.