I am doing some basic maths. I was to frustrate of Roger Bivand explaining stuff that I could not understand with my maths background (science background but loooong time ago!). I find a nice free book and practice with it. A lot can be done with pen + paper but sometimes you need to represent an equation in a Cartesian plane.
R is perfect for that (even if it is not a Computer algebra system) but I am always forgetting some specific ways to do it!
First we do a simple function:
\[y = \sqrt[3](1 - x^2)\]
simple_function <-function(x){ temp = (1- x*x)# R is using natural log so you need to adjust a bit, ie if you use negative# value you will get NaN :# kind of same idea of doing cube_root(-1) * cube_root(abs(x))sign(temp)*abs(temp)**(1/3)}simple_function(-5:5)
Here this is simple we generate a sequence of values and apply our function on it.
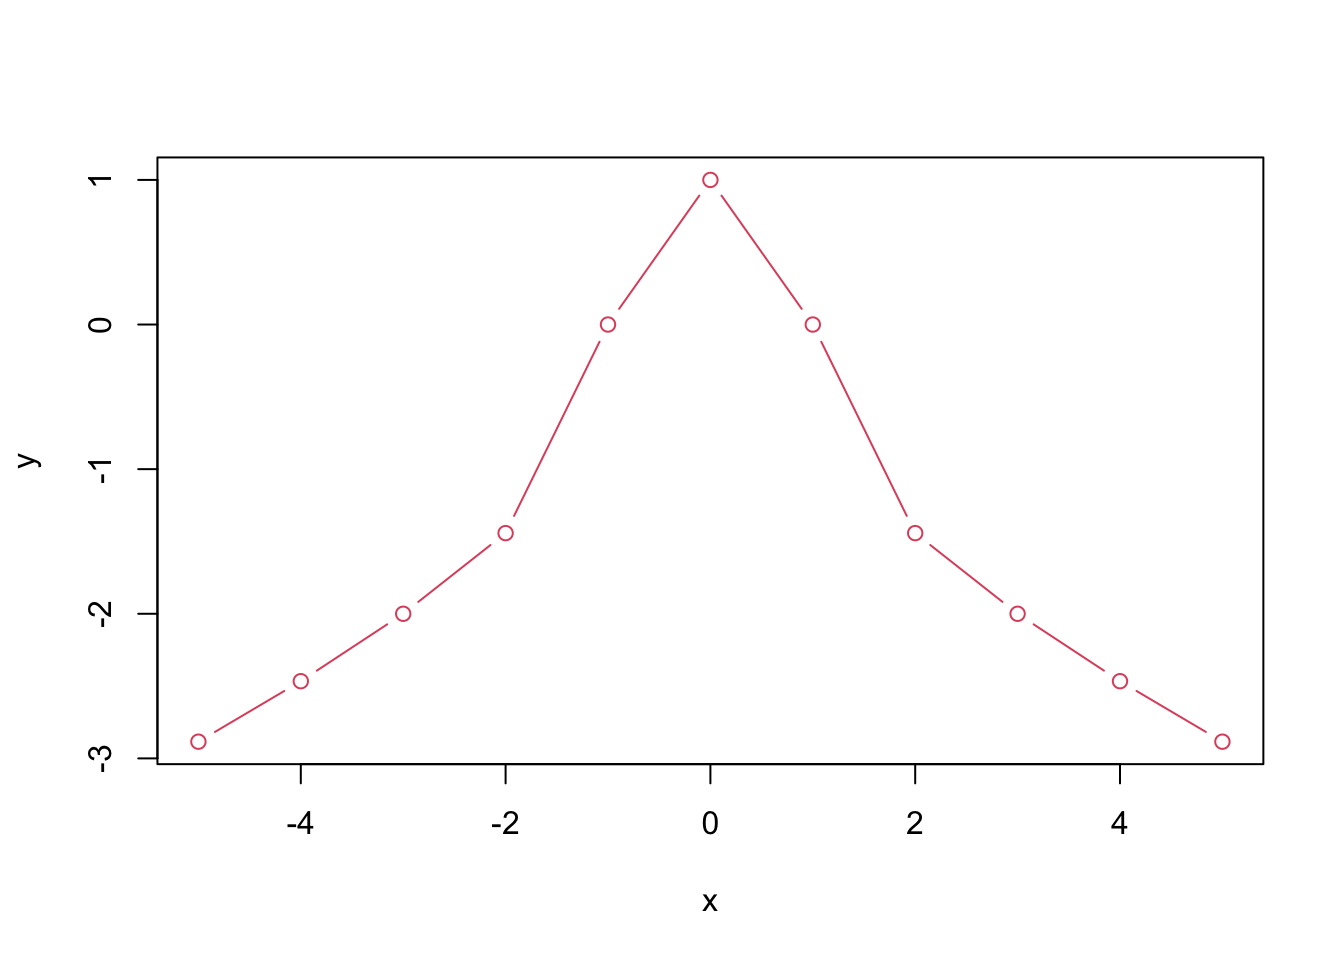
x <--5:5y <-simple_function(x)plot(x, y, type ="b", col =2)
# if you prefer it can also go in data frame because both vectors have the same length#df <- data.frame(x = x,# y = simple_function(x))
This is good but if you pay attention you can see that using type = "b" we are basically plotting the point and connecting them with a straight line. What happens if this is not a straight line:
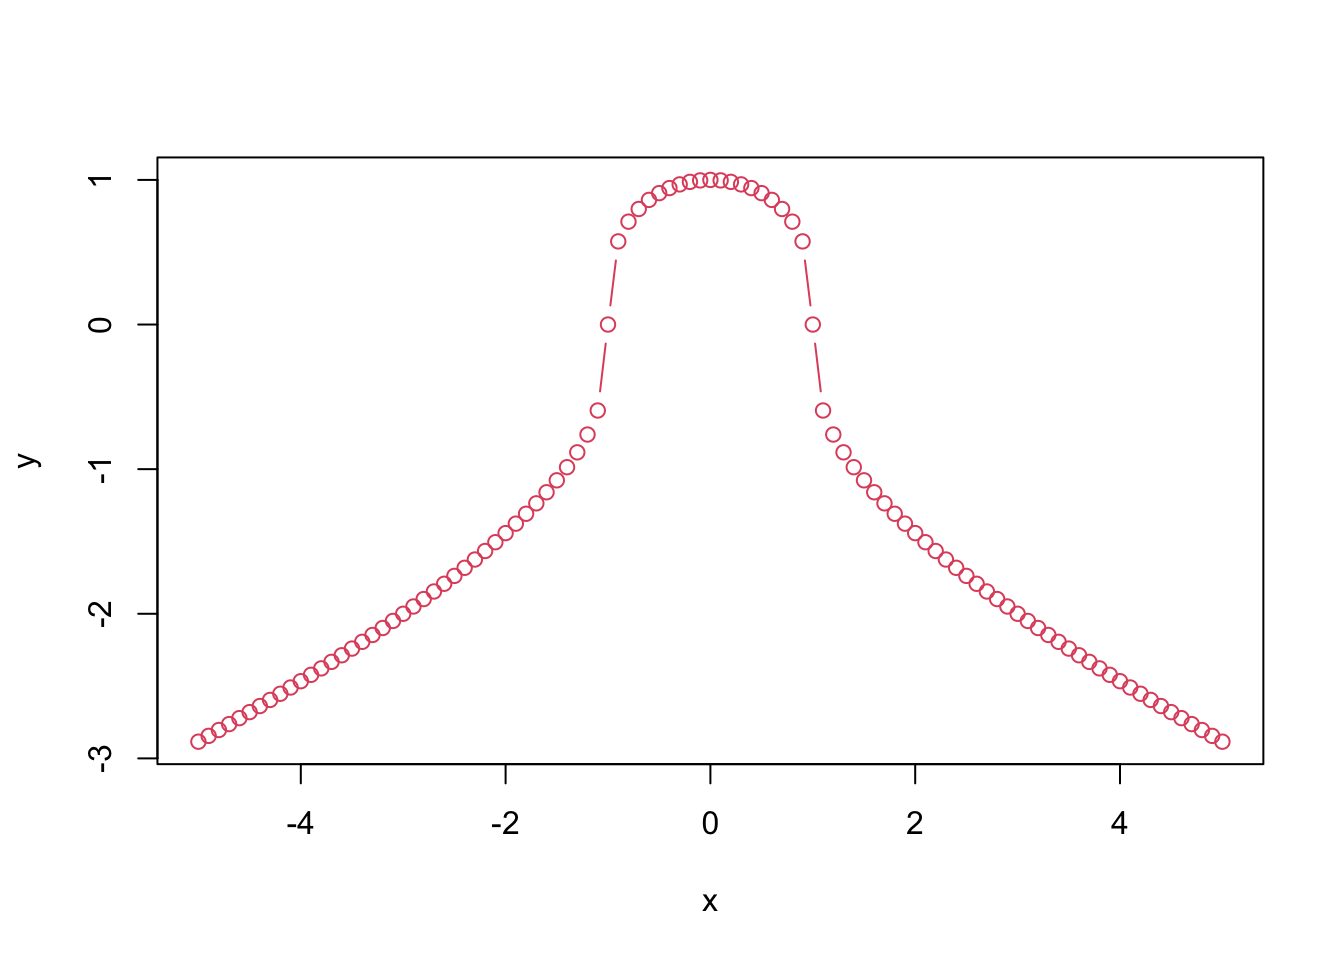
x <-seq(from =-5, to =5, by = .1)y <-simple_function(x)plot(x , y, type ="b", col =2)
This is a bit better!
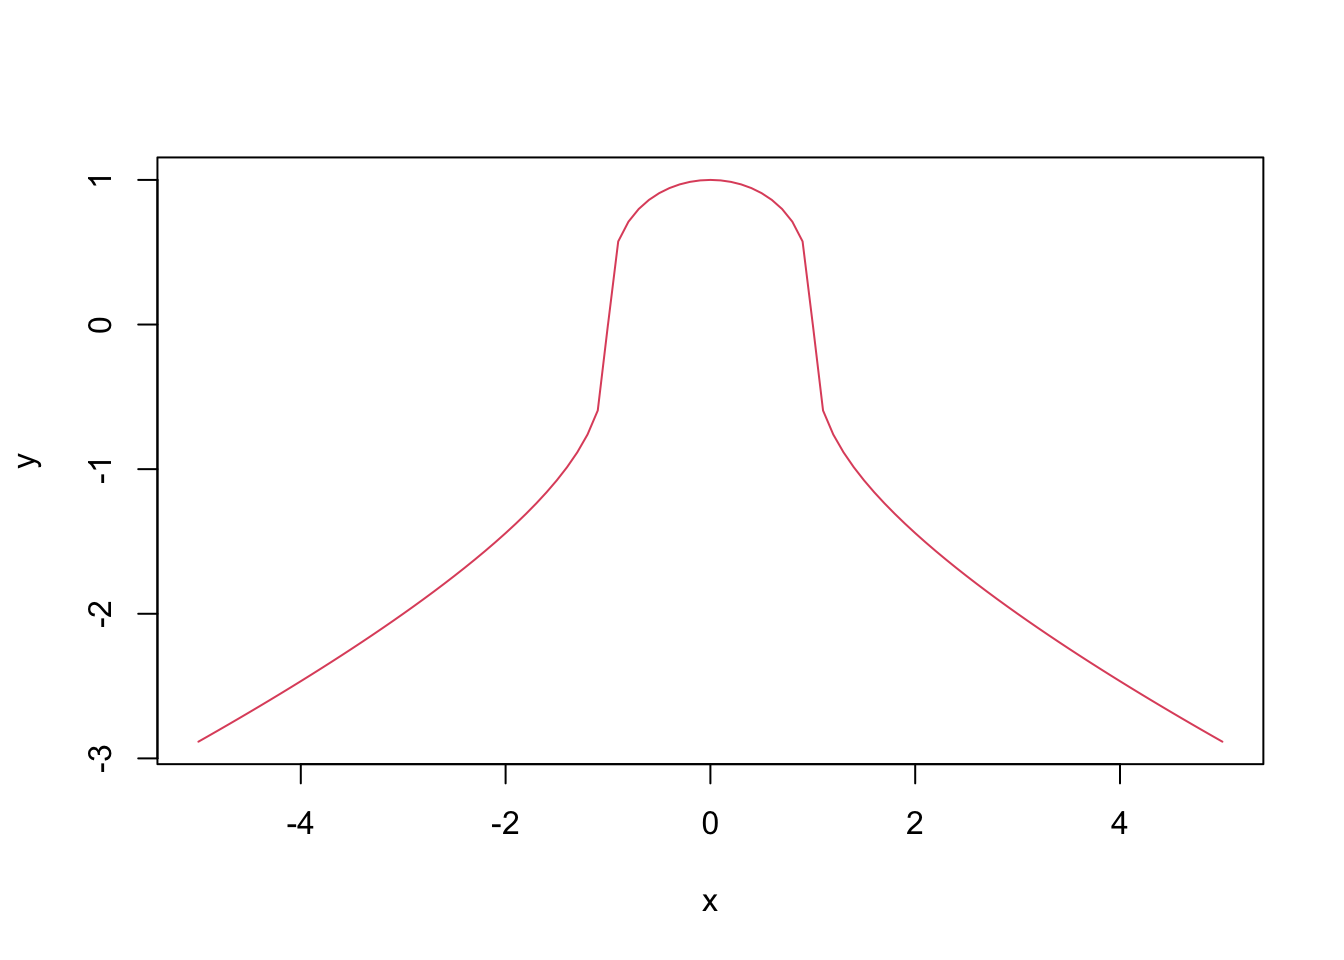
curve!
The base-R packagegraphics provide us with a lot of very cool functions and one of it is curve(). It can take a function or an expression.
curve(simple_function, from =-5, to =5,ylab ="y", col =2) # some small tuning is still needed